Free U-M Access
Course
Arranging and Visualizing Data in R
Learn to organize, summarize, and visualize data in R using tools like RStudio, ggplot, and data transformation techniques.
Your browser is ancient!
Upgrade to a different browser to experience this site.
Showing 1–25 of 81 items
Learn to organize, summarize, and visualize data in R using tools like RStudio, ggplot, and data transformation techniques.
Learn how to apply AI in healthcare diagnostics while understanding ethical, clinical, and technical considerations in medical decision-making.
Learn to ensure high data quality during collection and design processes to improve the integrity of research and analytics.
Use R and ggplot2 to explore public datasets and create insightful, equity-focused visualizations for planning and reporting.
Explore binary outcomes and build logistic regression models using R to analyze and predict health data with guided coding practice.
Apply Python and scientific libraries like NumPy and SciPy to solve statistical problems and explore probability, distributions, and relationships in data.
Explore how AI models work, challenge media myths, and gain tools to think critically about AI in society.

Assess how generative AI affects consumers, businesses, and public systems to support ethical and informed adoption of new technologies.
Use built-in Python data structures to perform increasingly complex data analysis and elevate your programming skills.

Examine ethical challenges in public sector data use and conduct policy analysis with R using real-world case studies.
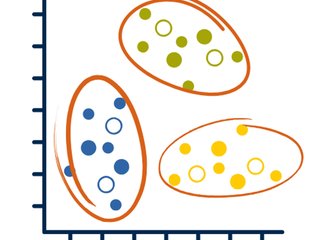
Discover how to use unsupervised learning techniques to find patterns in data, including clustering, topic modeling, and dimensionality reduction.
Get started with linear regression and learn how to analyze health data using statistical models, coding practice, and guided exercises.

Create relational database models using PostgreSQL, practicing data modeling, SQL commands, and schema creation through hands-on exercises.
Use SQL and Python to gather, store, and visualize data, including building web crawlers and working with databases.

Apply your Python skills in a final project to retrieve, process, and visualize data using real-world datasets.

Gain essential knowledge of generative AI applications, benefits, and risks, from societal impacts to legal and ethical concerns.

Explore governance strategies and global regulatory frameworks to ensure generative AI is deployed ethically and transparently in organizations.
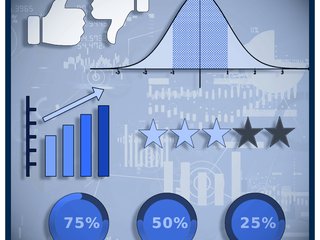
Build data literacy by learning how to interpret, describe, and critically evaluate everyday statistics and data presentations.

Learn to apply data analysis tools and statistical methods to evaluate public policies and inform decisions using R.

Explore how generative AI reshapes jobs and supports everyday tasks while impacting labor markets and workplace dynamics globally.

Explore generative AI essentials, ethical use, authorship, and regulation through expert insights on AI’s impact on society and work.
Learn statistical fundamentals, including study design, data visualization, and inference, while using Python tools like Pandas and Matplotlib to analyze data.
Explore networks and connections using Python’s NetworkX library to measure centrality, evolution, and structure in social systems.

Learn how to assess and improve data quality before analysis using the Total Data Quality framework.

Learn R programming and core data analytics skills by analyzing real public sector datasets using tidyverse and dplyr libraries.